R is a functional programming language with object-orientated abilities, designed for calculating statistics, using vectors.
The combination of the above attributes, result in a lean, intuitive way to script statisitcal analysis.
R is open source, growing in every dimension, further accomodating Big data and Machine Learning calculations, lean distribution of results, and integration with other computer platforms.
Finally, R is fun!
START HERE:
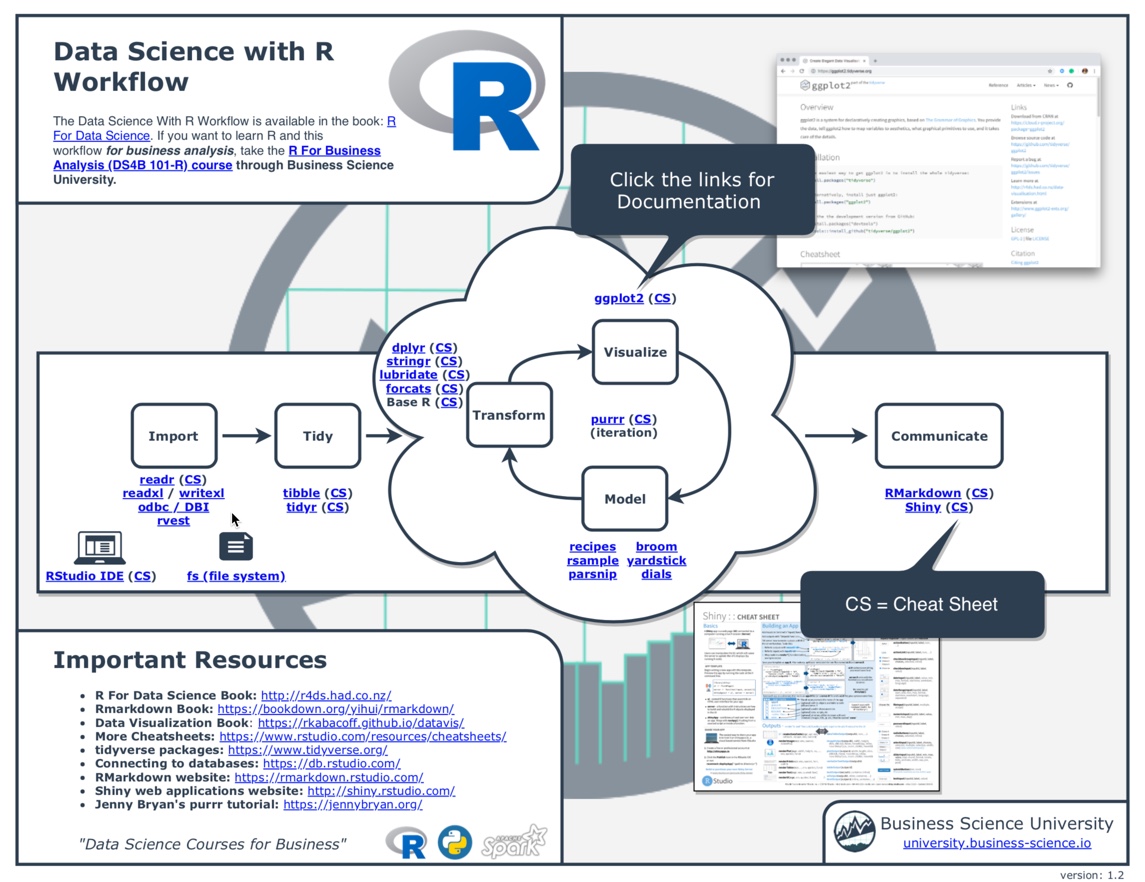
Today RStudio (Posit) IDE & Tidyverse apps are goto foundation to start any project.
RStudio IDE has 4 panels for scripting, showing computations, looking at data structures, and finally, resources and outputs. These panels are context-driven, depending on what application you are scripting with. RStudio IDE can also be used with non-R apps, such as Python and scripting for websites (HTML, CSS, Javascript etc).
Tidyverse is a R app that is intended to make both computers and humans happy.
Tidyverse creates data frames that are perfect for computational statistics. They are called “tibbles”, which are long and skinny dataframes, created from real-world data such as table summaries or features from databases.
Tidyverse also has scripting syntax that uses a “pipe”, a connection symbol, that allows humans to type procedures in time-logical order. This happens -and then- that happens -and then- the other happens… This is in contrast to the nested way that programming usually is scripted, which resembles the architecture of data being used.
R is the tool used to analyse data. This is done in 3 parts
- Gathering and preparing data for analysis
- Doing the analysis
- Reporting results from the analysis
- part 1: GATHERING AND PREPARING DATA FOR ANALYSIS
- Purpose: to get a clean dataset loaded into the R workspace
- Step1: load real-word datasets into workspace
- Step2: “split-apply-combine”
-
A foundational data-wrangling procedure, coined by Hadley Wickham author of Tidyverse and the tibble. It means that we split off just the data we want from real-world collections, apply fixes to the datasets so it can be combined with other datasets, to create a dataframe that statistical computers like.
- part 2: DOING THE ANALYSIS
- Purpose: an interactive process to understand what the data is saying, and then perhaps, acting on it.
- Understanding what data is saying - By looking at its patterns, or finding mathematical equations that describe it.
- Acting on it - Processing data further, by perhaps creating new variables from existing variables. (e.g. creating rates of change), comparing data to other data (e.g. compare to other datasets, or mathematical distributions), or predicting how data will change in future.
- part3: REPORTING RESULTS FORM ANALYSIS
- Purpose: Reports from data analysis can be published as whitepaper, infographics, and dashboards. Reports are usually written for private use, while infographics and dashboards are great for public consumption.
- Report types
- Infographics: data summarised into blocks on a poster (online | billboard | handout)
- Descriptive statistical plot: (online | poster | report)
- Statistical test results: look like gobbledigook, requiring translation into human readable form.
- Dashboard (Shiny)
- Dashboards are online posters. They give a quick summary of data in a way that is understandable to humans. A dashboard can be designed as an infographic or a standalone plot. An infographic is a poster sectioned into blocks containing summarised results, while a standalone plot has legends and labels explaining what the graph is about.
- Dashboard types:
- View only (static | realtime changing data)
- Interactive (interactive static data | interactive dynamic data)
DETAILS
HOW TO USE R FOR STATISTICAL & DATA ANALYSIS
- HOW DATA WORKS
- variable types
- continuous v categorical
- other: time data | string data
- variable distribution types: parametric v non-parametric (ranking order sets)
- HOW R WORKS
- R is vector-based - so all data must convert to vector-format to be computed
- scalar converts to vector in calculation
- matrices & dataframes have same length rows/cols - matrices are all same data type, while dataframe can have many datatypes
- list contains variables of many types and lengths - e.g. a customer profile & an array is a list of lists
- function process: take an object - do something to object - return an object
- MY FUNCTIONS
- about: Creat my own functions for repetative tasks
- why: It creates consistency in my programming analysis thought process
MODELING & DATA MINING
Once we have an idea of what our data is about, we can use computer modeling techniques for analysis. Computer procedures are based on mathematica of statistical modeling, or the mathematics of computer sorting procedures. There are many applications, and all are iterative processes to grow an information structure based on previous information.
Key similarities in modeling procesres, is the use of training and test datasets. Training datasets creates the mathematical model describing data, while test datasets see if the model can generalize. ie. be relevant to other similar data. The other key similariy is that there is extra error analysis on how confident we are that the model described what we wanted it too.
- modeling considerations
- learning types: supervised (regression | categorizing) v unsupervised
- model dataset preperations for "big data"
- model error analaysis, and our confidence in it

R FOR PSYCHOLOGY
- Personality Project & psych package. Revelle
- constructing psychometrics
- constructing personality studies
- using psych package
- Using R & tidyverse for psychology studies. Navarro
- Books
- Book: Introduction to R Navarro
- Book: R for Psychology Navarro
- Data collection for psychology experiments - javascript apps
- jPsych app - collecting data for traditional psychological experiments
- jaysire app Navarro - combines jpsych and R strengths
- Simulations - cognitive & learning psychology
- Rescola-Wagner model in R - learning rft patterns
- Cognitive architecture -> Deep & Reinforcement Learning (ML)
WORKFLOWS
R ANALYSIS WORKFLOWS
back home
|